

Learn how to measure contribution margins, identify your top profit-generating products, and optimize your margins in this must-read guide for your business.
Ultimately, the higher Contribution Margin a product has, the more valuable it is to the longevity of your business. Savvy merchants Contribution margin is an essential metric for anyone operating a product-based business. This metric reveals which products boost your bottom line, separating high performers from those who may be silently eating away at your profits.

Ultimately, the higher Contribution Margin a product has, the more valuable it is to the longevity of your business. Savvy merchants Contribution margin is an essential metric for anyone operating a product-based business. This metric reveals which products boost your bottom line, separating high performers from those who may be silently eating away at your profits.
Download Ware2Go’s guide to streamline your warehousing and fulfillment processes, reduce variable costs, and increase your contribution margin.
While the concept may seem straightforward, accurately calculating contribution margin can be challenging, especially when capturing variable costs. Many retailers struggle with this, potentially misallocating resources or making ill-informed inventory decisions.
This guide will discuss contribution margin, its formula, and examples. We’ll explore variable and fixed costs, common mistakes in calculation, and why measuring contribution margin is important for your business.
What Is Contribution Margin?
Contribution margin can be represented on a gross or per-unit basis. It is the total revenue a product generates after variable costs have been deducted. The resulting revenue helps pay for your business’s fixed costs (sometimes referred to as “sunk costs”).
Ultimately, the higher the contribution margin a product has, the more valuable it is to the longevity of your business. Savvy merchants will measure all the way down to the SKU level and find that, while an overall product category may have a low contribution margin, a specific colorway has a high one.
Why Is Calculating Contribution Margin Important?
When you understand, at a SKU level, which products are contributing to the profitability of your business, you can make more informed decisions around your product catalog. When only looking at gross profits, it can be easy to conflate sales velocity with profitability, but when you see contribution margin decrease as sales velocity increases on a particular product, you can quickly stop margin erosion by raising product costs or reducing variable costs.
Also, you might be surprised some products have more contribution margin than you thought. You may choose to double down on sales of those products to drive more profitability.
The video below explains how, if you don’t calculate contribution margin at the SKU level, you could mistake sales velocity for growth and over time, “sell yourself out of business”.
Contribution Margin Formula
While the formula is simple, finding the variables is relatively complex. The formula is as follows:
Total Revenue – Variable Costs = Contribution Margin
You can also measure it as a percentage of revenue by dividing the contribution margin by total revenue:
Total Revenue – Variable Costs/Total Revenue = Contribution Margin (in percentage)
Variable costs can be difficult to measure. Unlike fixed costs or standard operating costs that do not change with volume,Variable costs change according to the volume of products being manufactured, sold, and delivered.
Examples of Variable Costs
Some variable costs decrease as volume increases. The classic example is volume discounts from suppliers. However, many merchants chase volume discounts at the expense of margin because other variable costs increase at higher volumes, including:
- Transportation costs
- Storage
- Labor
- Shipping rates and surcharges
To accurately measure Contribution Margin, it’s key to include all variable costs from production to final mile delivery.
Examples of Fixed Costs
Understanding fixed costs is crucial for businesses aiming to optimize their contribution margin. Fixed costs, such as machinery expenses, salaries, rent, utilities, insurance, and loan repayments, remain constant regardless of production levels.
While these costs do not fluctuate with the volume of goods produced, they significantly impact overall profitability. By analyzing these expenses, companies can better manage their resources, set pricing strategies, and improve their financial health. In this section, we will explore various examples of fixed costs and their implications on a company’s bottom line.
- Machinery costs
- This is usually a one time investment as equipment typically has a long useful life. The machinery will depreciate over time which is viewed as a fixed cost as it does not affect production.
- Salaries
- Salaries fall under Selling, General, and Administrative expenses. These are a fixed cost (expense) on a company’s income statement.
- Rent and lease costs
- Rent and Lease costs are a fixed cost usually paid monthly that would fall under an expense on the income statement. The rent is fixed regardless of the production volume.
- Utility bills
- Utilities may fluctuate across billing cycles, but they are a fixed operating expense on the income statement.
- Insurance costs
- Insurance is considered an operating expense and reflected on the income statement. This expense does not affect production.
- Loan repayment costs
- Loan repayment is considered a liability and is reflected on the balance sheet. This does not affect production or any other operations.
What is Gross Profit Margin?
Gross profit margin is the portion of sales revenue a company retains for profit after subtracting all Cost of Goods Sold (COGS) from revenue. COGS refers to the expenses directly related to the production of a good. Gross profit margin takes into account both fixed and variable costs, and is used to measure a company’s financial health. It is presented as a percentage and varies by industry. If a company had a Gross Profit margin of 20% this would indicate that they made a profit of $0.20 on each dollar of sales after deducting COGS.
Gross Profit Margin Formula
Gross Profit Margin is calculated using the following formula:
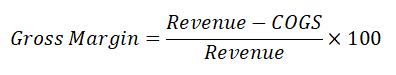
If company X earned $20,000 and its COGS was $8,000 then the gross profit would be $12,000 or ($20,000 – $8,000). The gross margin would be 60% or ($20,000 – $8,000) / $20,000.
Contribution Margin vs Gross Profit Margin
In the realm of financial analysis, understanding the distinction between contribution margin and gross profit margin is essential for businesses navigating their supply chain. While contribution margin serves as an internal metric—allowing for nuanced decision-making—gross profit margin acts as an external indicator of financial health, often reflected in financial statements. Ahead, we’ll examine four key differences and their implications for businesses.
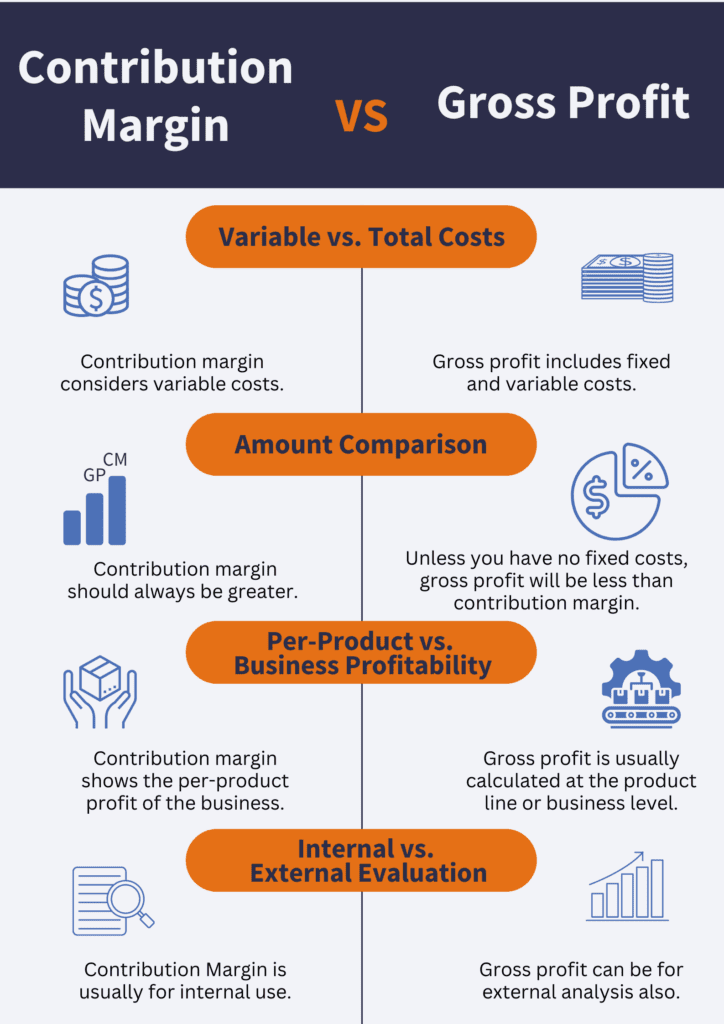
1 . Contribution margin only considers variable costs while gross margin includes both fixed and variable costs.
a. Companies are not required to report on their variable costs. This allows contribution margin to remain an internal measurement. Gross margin is also not required on financial statements, however financial statements must show the total revenue and COGS. Therefore, gross margin is inadvertently presented on the financial statement and is an external measuring tool.
2. Contribution margin should always be greater (because it doesn’t take out fixed costs).
a. Gross margin takes into account all fixed and variable COGS. Contribution margin on the other hand only focuses on per-unit variable costs so it should always be higher than gross margin.
3. Contribution margin is typically calculated as per-product profitability, gross profit is generally shown as business’s total profitability.
a. Contribution margin is typically used on a per-product basis to show the amount of profit an individual product generates to cover fixed costs. Gross profit margin is used to show the financial health and revenue post COGS of a company.
4. Contribution Margin is more of an internal evaluation measurement while outsiders may use gross profit to analyze if a business is growing.
a. It is easier to shift costs from variable to fixed with contribution margins because they are held internally. Thus, allowing companies to manipulate and hide expenses. Gross margin on the other hand is a very transparent value as it is reflected on multiple financial statements.
The value of calculating Contribution Margin is understanding how volume affects profitability. If Contribution Margin increases as sales increase, you know you have a product that will help your business grow sustainably.
How to Optimize Contribution Margin
To increase Contribution Margin, you can either increase the price of the product (to increase revenue) or decrease variable costs. For example, if you sell folding chairs for $25 each, with variable costs at $18, your Contribution Margin is $7.
25 (Revenue) – 18 (Variable costs) = 7 (Contribution Margin)
If you increase the price of the folding chairs to $27, your Contribution Margin will rise to $9.
27 (Revenue) – 18 (Variable costs) = 9 (Contribution Margin)
Or, if you decrease the variable costs to $15, your Contribution Margin will increase to $10.
25 (Revenue) – 15 (Variable costs) = 10 (Contribution Margin)
However, it’s important to find the right balance between price, quality, and profitability. If you increase your price too much, you might lose a substantial number of customers to competitors. If you cut variable costs to the extent that it damages the quality of your product, you can hurt your brand’s reputation.
McKinsey warns that chasing after margin with no consideration of consumer price tolerance or product marketing spend can eventually turn your highest performing SKUs upside down. If you can’t find the right balance, it may be best to simply cut that product from your catalog
Optimizing Variable Costs
Variable costs are hard to track and even harder to control. However, putting in the effort to track and control your variable costs benefits overall contribution margin and profitability in three ways.
1. Inventory in the right place at the right time
- No more long-zone shipments or costly overnight air to maintain marketplace SLAs
- No more costly stockouts or inventory obsolescence
2. Profitability across all sales channels
- No more lost margins in the battle for the Buy Box
- No more lost sales from feeding inventory to the wrong channels
3. Lower Customer Acquisition Costs (CAC)
- No more overpaying for Cost per Click (CPC) ads in locations with poor conversion rates
- No more lost customers due to poor service levels
Common Contribution Margin Mistakes
This section will discuss 3 common mistakes retailers make regarding contribution margin.
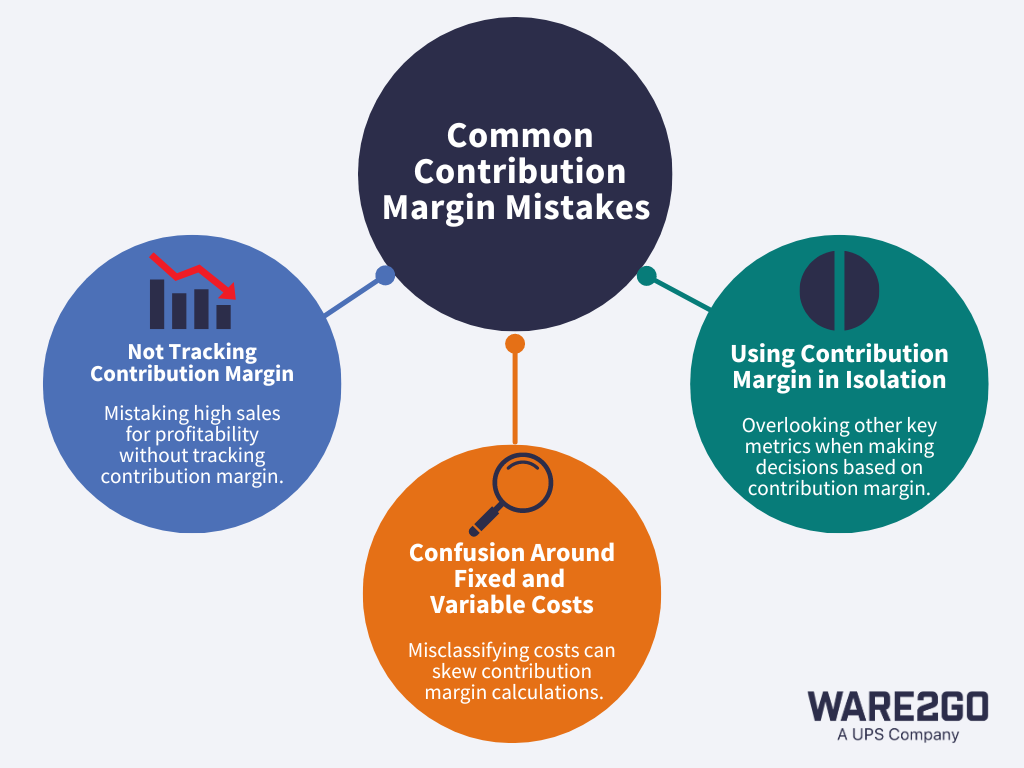
Importance of Tracking Contribution Margin
If a company is not tracking contribution margin they could potentially be losing money or missing opportunities for growth. A product with a high sales volume does not mean it has a positive contribution margin, it is possible that it could be negatively impacting the company’s overall profit. Likewise a product with low sales volume could have a high contribution margin and be an opportunity for growth.
Confusing Fixed and Variable Costs
Typically, it is easy to distinguish between fixed and variable costs but there are some expenses that can be a bit tricky. For instance, utilities are usually looked at as a fixed cost, however there are some variable components like usage that can change MoM. Similarly subscriptions are usually fixed MoM but there are times when prices will fluctuate.
Using Contribution Margin in Isolation
Contribution margin should not be the only metric used to base business decisions on. Although it is a great tool to look at product profitability, there are several other metrics that cover major areas that will help to round out business decisions. Other metrics include operating profit, other comprehensive income, pre-tax profit, net income, and gross profit. For example, gross profit margin takes a look at profit after fixed and variable costs of goods sold.
How to Accurately Track Variable Costs
Accurately tracking variable costs is crucial for determining contribution margin and making informed business decisions. To achieve this, companies should implement a comprehensive approach that involves monitoring all sales, marketing, and supply chain data and expenses.
First, utilize data analytics tools to collect real-time sales data. By examining sales trends and customer behavior, businesses can identify fluctuations in demand and adjust their variable costs accordingly. Additionally, maintaining detailed records of marketing expenditures—such as promotional campaigns and advertising costs—allows companies to evaluate the effectiveness of their marketing strategies and make necessary adjustments.
In the supply chain, it’s essential to track costs associated with materials, labor, and logistics. Implementing a robust inventory management system can help monitor these expenses, ensuring that variable costs are accurately reflected in financial reports. Regularly reviewing supplier contracts and negotiating terms can also lead to cost savings that positively impact the contribution margin.
Finally, fostering cross-departmental collaboration ensures that all teams are aligned in tracking variable costs. This holistic approach not only enhances financial accuracy but also supports strategic decision-making, ultimately leading to improved profitability and operational efficiency. By diligently monitoring these costs, businesses can gain valuable insights into their per-product profitability and overall financial health.
Ware2Go, a UPS Company, offers full visibility across your supply chain to more accurately track variable costs. Track your average time in transit (TNT) per shipment to optimize your final mile delivery costs, compare transportation rates on platform to ensure the best possible pricing, and measure sales velocity against storage and fulfillment costs to optimize inventory carry costs. Learn more about our fulfillment technology here.
Frequently Asked Questions (FAQs)
What is a contribution margin of 40%?
- A contribution margin of 40% indicates that for every dollar of sales revenue, $0.40 is being contributed to covering fixed expenses and generating profit.
Is contribution margin the same as gross profit margin?
- No, contribution margin and gross profit margin are not the same. Contribution margin only accounts for variable costs on a gross or per-unit basis to determine the profitability of a product. Its profit is then contributed to paying back all fixed costs. Gross margin focuses on the removal of COGS both fixed and variable to determine the amount of revenue retained after expenses.
What is another name for contribution margin?
- Contribution margin can also be referred to as the dollar contribution per unit. It is sometimes referred to as gross margin, however gross margin and contribution margin are two different metrics.
Can contribution margin be negative?
- Yes, contribution margin can be negative. A negative contribution margin would indicate that a product’s variable costs are greater than its net sales revenue. This would mean that a company is losing money with every sale of that product.
Ware2Go Makes Contribution Margin Tracking Easier
It might be possible to coast on high-volume, low/no-profitability sales for a while, but sooner or later, those sales with negative or low contribution margins will eat at your profitability and leave you scrambling for cash to keep your business floating.
Ware2Go’s comprehensive supply chain reporting tools solve this problem by giving you deep insight into how every part of your supply chain operates, including the costs incurred. That way, you can easily track your variable costs and contribution margin to make better business decisions.
Contact one of our fulfillment experts to learn more about Ware2Go’s supply chain technology today.